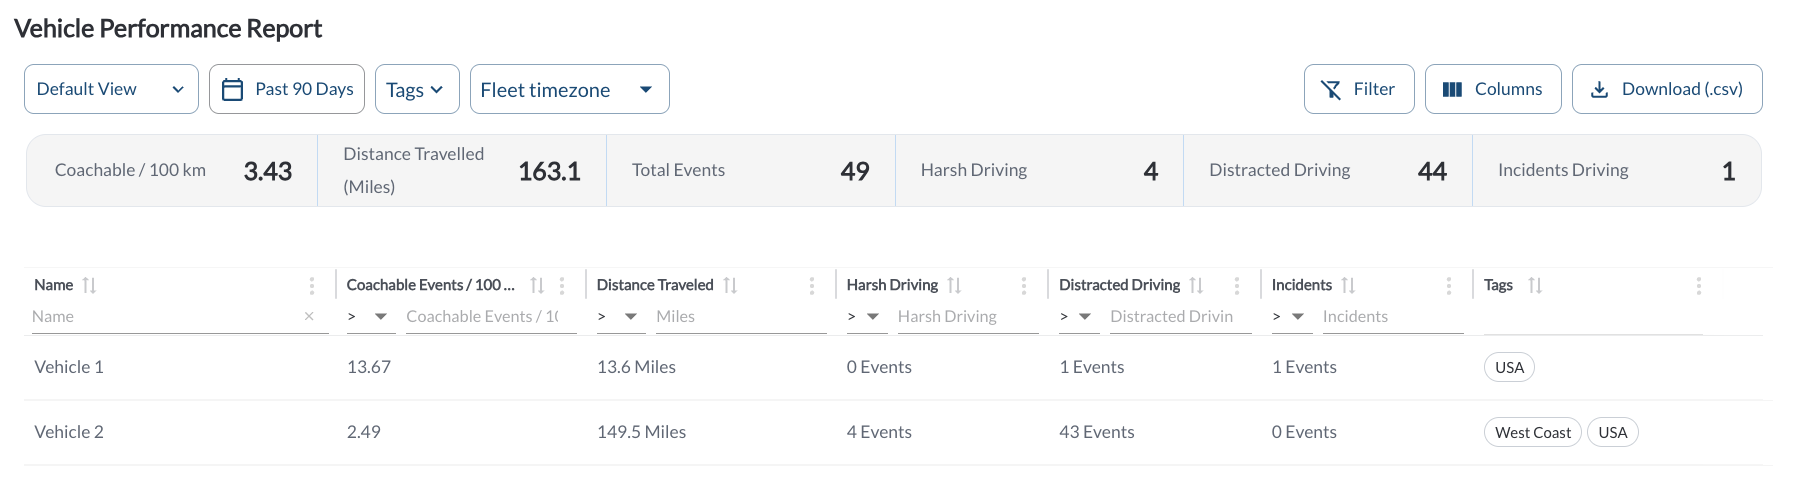
The Vehicle Performance Report is a per-vehicle activity view. It shows one row per asset for the selected period, together with the events recorded and the distance driven. Use it to see which vehicles are generating the most coachable behavior relative to the distance they cover.
Summary Bar
A card across the top of the tab summarizes the whole fleet for the selected period.
| Coachable / 100 km |
The number of coachable events per 100 km driven across the fleet. |
| Distance Travelled |
The total distance driven across the fleet. |
| Total Events |
All safety events in the period. |
| Harsh Driving |
The number of Harsh Driving events. |
| Distracted Driving |
The number of Distracted Driving events. |
| Incidents Driving |
The number of Incidents events. |
Vehicle Performance Report Details
The table supports downloading, sorting, filtering, resizing columns, and other customization options. For a complete guide, read the article How to Use Tables in the App.
| Name |
The asset name. |
| Coachable Events / 100 km |
The number of coachable events per 100 km driven by the asset. Use this column to compare vehicles that drive very different distances. |
| Distance Traveled |
The distance driven by the asset in the selected period. |
| Harsh Driving |
The number of Harsh Driving events recorded for the asset. |
| Distracted Driving |
The number of Distracted Driving events recorded for the asset. |
| Incidents |
The number of Incidents events recorded for the asset. |
| Tags |
The tags assigned to the asset. Tags can be added and managed in the Settings page. Read the article Tags Settings. |
Filtering
-
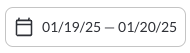
Use the Date Picker to select a different date range. The default date range is Today. For more details on using the Date Picker, read the article How to Use the Date Picker.
-
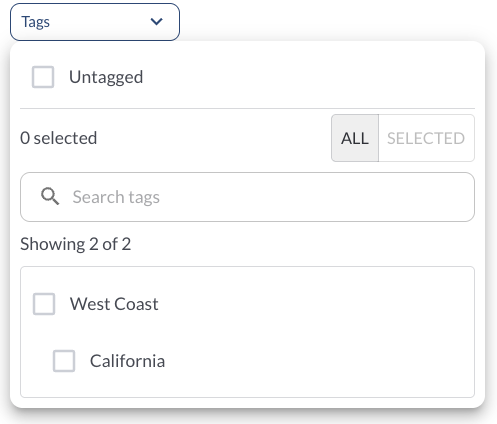
Use the Tag Filter to narrow down the table to display only trips associated with specific tags.
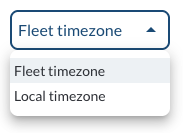
- Use the Timezone Filter to select how timestamps are displayed and how data is fetched based on the selected timezone.
Custom Report Widget
Save time by using the Custom Report Widget to store report configurations with your selected filters, columns, sorting, and grouping. This allows you to quickly return to commonly used report setups and set a default configuration for easy access. For more information, read the article How to Use the Custom Report Widget.